Framework

The Dollar Transmission Chain

The dollar is not just a price. It is part of a transmission system connecting policy, rates, funding, liquidity, risk appetite and asset prices.

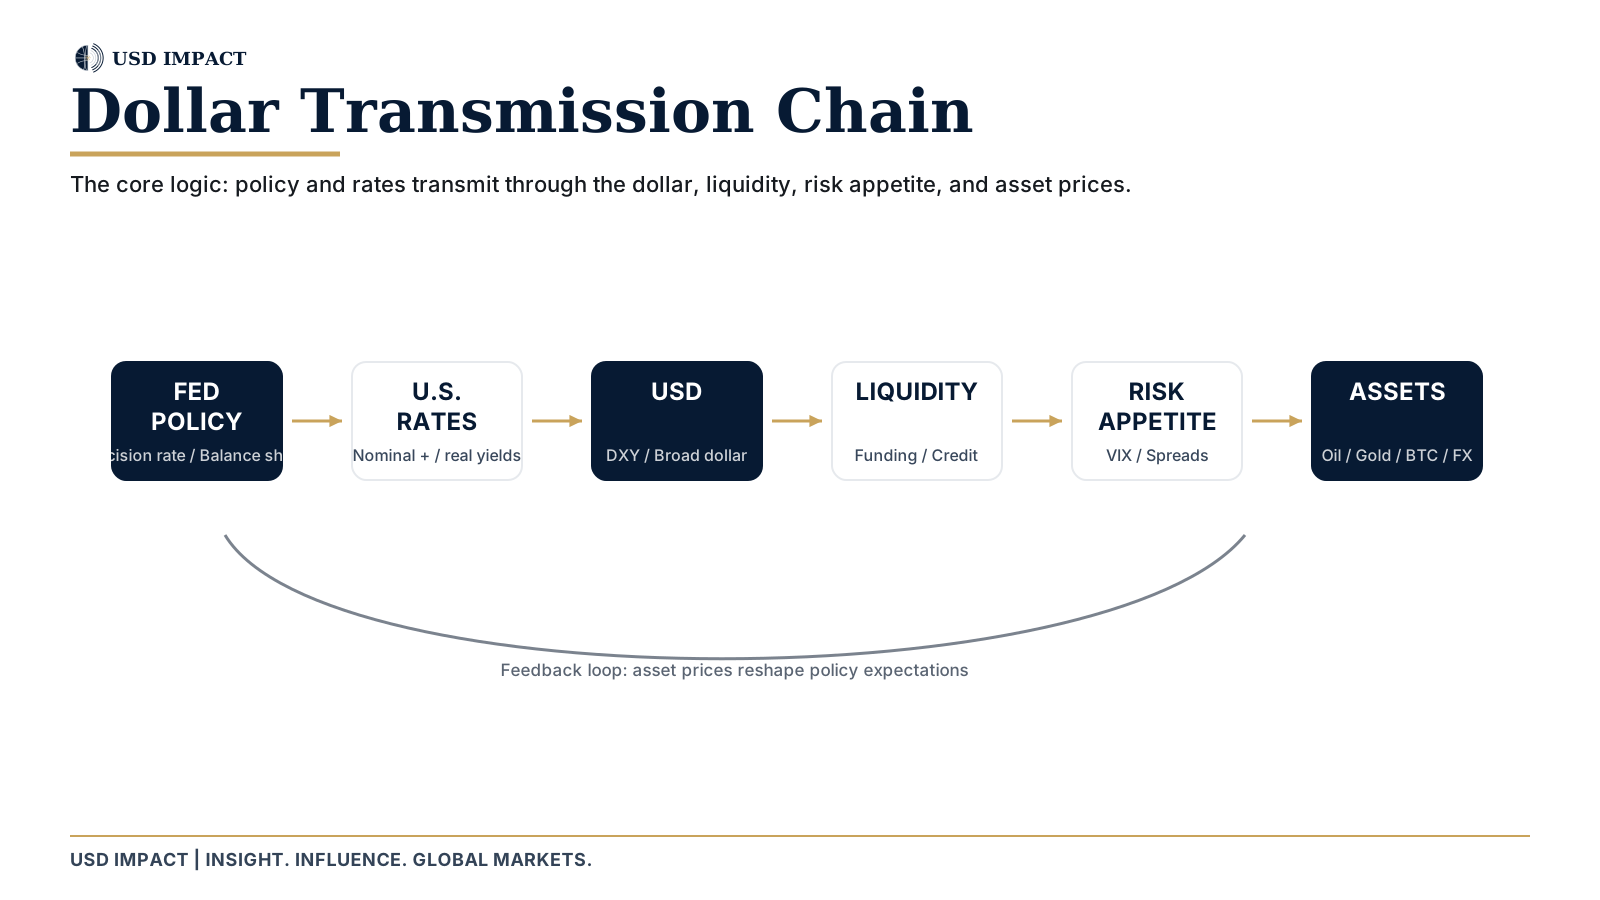
The Dollar Transmission Chain

What the diagram is trying to show

Market headlines often reduce a complex move to one sentence: “the dollar rose,” “the Fed was hawkish,” or “liquidity improved.” The transmission chain forces a second question: what changed first, through which channel, and where did the effect appear next?

A useful simplified sequence is:

Macro information / policy → rates → dollar and funding conditions → liquidity / risk appetite → cross-asset effects

This is not a mechanical formula. The arrows can reverse, several channels can operate at once, and an asset-specific shock can interrupt the sequence. The purpose is to make the causal story explicit enough to test against observable evidence.


Stage 1 — Macro information and policy

The chain can begin with scheduled data, central-bank communication, fiscal or Treasury-market developments, a geopolitical event, or an unexpected funding shock.

Examples include:

The key is not to assume that every event matters equally. Ask what expectation changed and whether the change was already priced.

Common mistake: treating the event itself as the explanation. Markets respond to the difference between outcomes, expectations and positioning, not only to the headline.


Stage 2 — Nominal and real rates

Rates are one of the main transmission channels between macro information and the dollar.

A change in expected policy can move short-term Treasury yields. Growth, inflation, supply and term-premium expectations can move longer-term yields. For many cross-asset questions, the distinction between nominal yields and real yields matters.

A higher nominal yield does not automatically mean tighter real-rate conditions if inflation expectations rise by the same amount or more. Conversely, real yields can rise even without a dramatic move in the headline nominal rate.

For that reason, the USD Impact framework treats real-rate pressure as its own dial rather than using DXY as a substitute for rates.

Learn more: Real rates.


Stage 3 — Dollar direction and relative pricing

The dollar responds partly to relative rates: U.S. yields and policy expectations matter in comparison with conditions elsewhere.

DXY is a useful market measure, but it is not the entire dollar system. A DXY move can be heavily influenced by the euro or yen. Broader Federal Reserve dollar indices help test whether the move is generalized across trading partners.

That is why broad-dollar confirmation belongs inside the dollar-direction dial. It is a check on the breadth of the move, not a separate fourth dial.

Useful questions:

Learn more: DXY and Broad USD.


Stage 4 — Funding and liquidity

The dollar is also a funding currency. Global borrowers, banks, companies and investors may need dollars regardless of the direction of DXY.

During stress, demand for dollar funding can rise while risky assets fall. Credit spreads can widen, volatility can increase and market depth can deteriorate. In that environment, a stronger dollar can reflect a scramble for liquidity rather than a simple interest-rate advantage.

In easier conditions, funding stress can recede even if policy rates remain relatively high. That is one reason the framework keeps liquidity stress as a separate dial.

Useful evidence can include:

No single series is a complete measure of global liquidity. The goal is confirmation across several indicators.

Learn more: Liquidity stress.


Stage 5 — Risk appetite and positioning

Rates, the dollar and funding conditions influence the environment in which investors take risk, but they do not dictate a single portfolio response.

When financing becomes more expensive or uncertain, leveraged and duration-sensitive positions may be reduced. When volatility falls and funding conditions improve, risk capacity can increase. Positioning can amplify both moves.

This stage matters because the same macro impulse can have different asset effects depending on starting valuations, positioning and market structure.

Common mistake: assuming that “risk-on” and “risk-off” are permanent relationships. Gold, the dollar and Treasuries can behave differently across inflation shocks, banking stress, geopolitical events and policy transitions.


Stage 6 — Cross-asset transmission

The final observable effects can appear across several asset classes.

Gold

Gold can respond to real yields, the dollar, inflation expectations, risk demand, reserve-management activity and other factors. A stronger dollar may be a headwind in some regimes, but a stress episode can support both gold and the dollar at the same time.

Oil

Oil is priced in dollars, but supply, demand, inventories, geopolitics, OPEC+ policy and global growth can dominate the currency effect. A weaker dollar does not guarantee higher oil prices.

Bitcoin

Bitcoin can be sensitive to liquidity and risk appetite, but crypto-specific regulation, flows, leverage and market structure can overwhelm the macro signal.

Equities

Equities can respond to discount rates, earnings expectations, financing conditions and currency translation. A stronger dollar can affect multinational earnings differently from domestically focused companies.

FX

Other currencies reflect relative policy, growth, trade balances, political risk and capital flows. A broad USD move and a single bilateral currency move should not automatically be treated as the same phenomenon.

The transmission framework therefore asks whether several assets confirm the proposed mechanism rather than assuming that one correlation proves it.


Worked example — one dollar move, two different regimes

Consider two hypothetical weeks in which DXY rises by roughly the same amount.

Scenario A — rate-led strength

  1. U.S. inflation data surprise to the upside.
  2. Market pricing shifts toward tighter policy or fewer future cuts.
  3. Real and nominal Treasury yields rise.
  4. DXY and the broader dollar strengthen.
  5. Credit spreads and volatility remain relatively contained.
  6. Gold and long-duration equities face rate-related pressure.

The strongest evidence points to a rates channel. The dollar is part of the transmission, but funding stress is not the main driver.

Scenario B — liquidity-stress strength

  1. A funding or banking shock raises demand for liquidity.
  2. Volatility and credit spreads rise.
  3. Risky assets weaken and leverage is reduced.
  4. Demand for dollar funding increases.
  5. DXY and broader dollar measures strengthen.
  6. Gold may also strengthen if safe-haven demand is large enough.

The same headline—“the dollar strengthened”—now describes a different regime. The dominant mechanism is liquidity and risk stress, not simply higher U.S. rates.

Why the distinction matters

If the causal explanation is wrong, the interpretation of the next data point can also be wrong. A fall in yields might weaken a rate-led dollar move, but it might not resolve a funding-driven dollar shortage. The framework therefore tracks the driver, not just the direction.


Reverse transmission also matters

The chain does not always start with the Federal Reserve.

A sharp oil shock can raise inflation expectations, move yields and then affect the dollar. A geopolitical event can move energy, safe havens and FX simultaneously. A foreign banking shock can raise dollar funding demand and eventually influence central-bank liquidity policy.

So the correct mental model is a network with a preferred reading order, not a one-way machine.


How to use the chain in a Daily USD Impact edition

For each major development, separate the analysis into five layers:

Layer Question
Event What objectively changed?
Rates Did nominal or real yields respond?
Dollar Did DXY and broader USD measures confirm?
Liquidity / stress Did credit, volatility or funding conditions tighten or ease?
Assets Which markets confirmed or contradicted the proposed transmission?

If a layer cannot be verified, leave it unresolved rather than forcing the story.


What the chain does not prove

The framework does not prove causality merely because markets moved in sequence. It also does not establish predictive power for the USD Impact Score or any other indicator.

The strongest use of the chain is descriptive and diagnostic:


Key takeaway

Do not stop at “the dollar moved.” Trace what moved before it, what confirmed it, and what moved after it.

Use the three dials—dollar direction, real-rate pressure and liquidity stress—to locate the dominant channel. Then use cross-asset behavior as evidence for or against the proposed transmission.

Next: turn this reasoning into a repeatable weekly process with the Three-Dial Macro Dashboard.

Compliance note: Educational only. Not investment, legal, tax, trading, or financial advice. Not a recommendation, forecast, or trading signal. Transmission paths are conditional, can run in both directions, and may be dominated by asset-specific shocks.